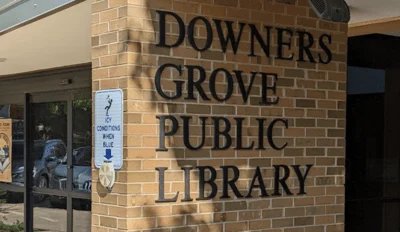
The data shows that the released offender was a man. He was convicted in 2013 when he was 23.
Under state law, paroled offenders are still in legal custody of the IDOC, meaning they can be taken back to a correctional center at any time if the state has probable cause or a warrant.
The table below shows the 50 zips in Illinois with the most paroled offenders in 2018 who were convicted of drug crimes.
Prisoners convicted of drug crimes paroled in 2018
Zip
Total # of Parolees
% Women
% Men
Median Age
60624
223
5.8%
94.2%
36
60644
221
9.5%
90.5%
38
60623
163
5.5%
94.5%
36
60651
143
7%
93%
38
60608
101
6.9%
93.1%
37
60628
97
7.2%
92.8%
40
60607
96
16.7%
83.3%
44
60612
94
8.5%
91.5%
41
60619
89
12.4%
87.6%
40
60620
84
9.5%
90.5%
39
60636
80
8.8%
91.2%
38
60621
59
3.4%
96.6%
42
60617
55
10.9%
89.1%
41
60901
52
0%
100%
41
60649
49
6.1%
93.9%
38
60609
48
4.2%
95.8%
42
60637
47
2.1%
97.9%
40
60629
45
4.4%
95.6%
39
60085
41
7.3%
92.7%
37
60505
41
21.9%
78%
35
62526
37
5.4%
94.6%
35
62301
37
24.3%
75.7%
37
62703
35
2.9%
97.1%
38
61701
34
8.8%
91.2%
39
60153
32
3.1%
96.9%
39
61832
31
25.8%
74.2%
39
60435
31
16.1%
83.9%
34
60411
31
0%
100%
38
60647
28
14.3%
85.7%
43
60639
28
0%
100%
37
62959
27
14.8%
85.2%
37
61032
26
15.4%
84.6%
35
60426
26
15.4%
84.6%
39
61605
26
0%
100%
39
62801
25
16%
84%
36
60643
25
8%
92%
37
60406
24
4.2%
95.8%
39
61102
24
8.3%
91.7%
35
60436
24
4.2%
95.8%
33
61554
24
16.7%
83.3%
33
62702
24
4.2%
95.8%
35
62002
24
20.8%
79.2%
34
60653
24
0%
100%
41
61603
22
9.1%
90.9%
38
60645
21
0%
100%
44
60409
20
0%
100%
42
62040
20
20%
80%
35
62864
20
20%
80%
33
61201
19
10.5%
89.5%
37
60506
19
21.1%
79%
36


 Alerts Sign-up